Live Sales Overview
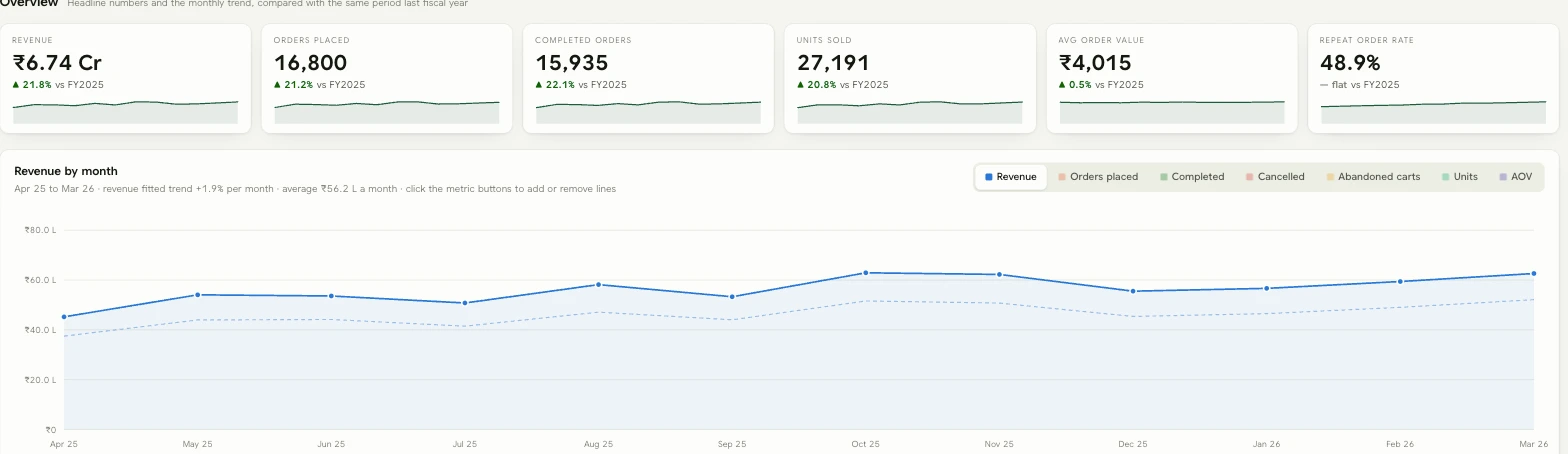
Revenue, orders, units and average order value in one glance, compared automatically against the same period last year.

For Operations & Sales Teams
One dashboard for stock, sales and channel performance, built to answer the questions your team asks every day
Stock levels, sales performance and channel mix in one place, so decisions don't wait for someone to build a spreadsheet.
Revenue, orders, units and average order value in one glance, compared automatically against the same period last year.
See what's low, what's overstocked and what needs reordering, ranked by product, before it turns into a stock-out or dead stock.
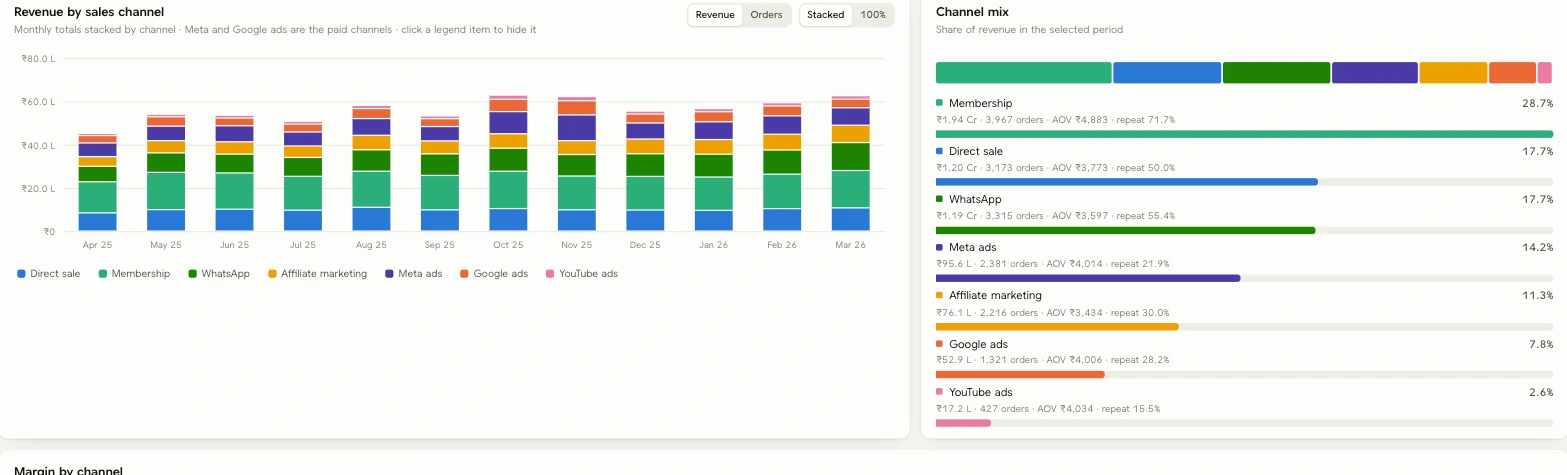
Compare direct sale, online, partner and paid channels side by side, and see what each one actually leaves after cost, not just top-line revenue.
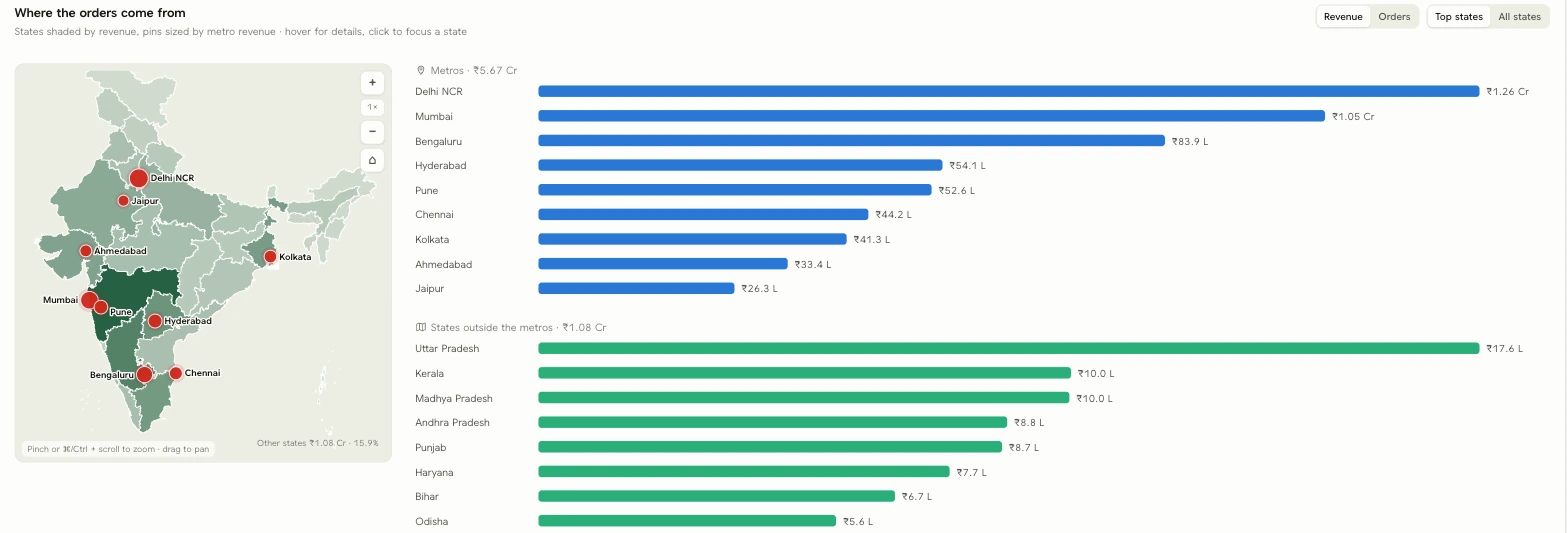
A live map of where orders come from, down to the city, so you know which markets are growing and which need attention.
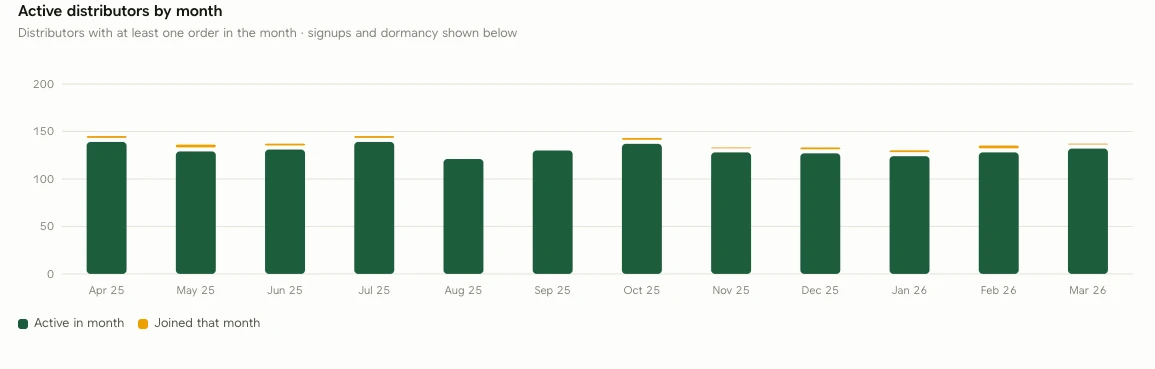
Track field teams or partner networks over time: who's active, who joined, who's gone quiet, and where to follow up first.
Every view filters by date, region, category and channel, and exports cleanly, so a board update stops being a half-day job.
Product Preview
Product Preview
Product Preview

Talk directly with our product managers about planning and delivery.
Say Hello